
Quickstart: your first monitor in 5 minutes
One HTTP monitor, end to end: add it, understand when it alerts, route the alert to a person, and fire a real test incident.
By Chris Collareta · Published · Updated
What do I need before I start?
Two things, and no install:
- A URL that returns a known status code, such as a
/healthendpoint. - A Faultline account. Sign up at app.fltln.io; the Free plan covers 5 monitors and needs no card.
1. Add the service (about 1 minute)
- Open Services and click Add Service.
- Choose HTTP and click Next.
- Enter the URL, the method (usually GET), and the status code a healthy response returns (usually 200).
- Name it and pick a check interval. Free checks every 60 seconds; Pro goes down to 30 seconds, and 15 with the interval add-on.
- Click Add Service. The first check runs within one interval.
Prefer the terminal? With an API key (Pro), the CLI does the same thing:
faultline check create checkout-api --type http \
  --url https://shop.example.com/health --interval 60
What does an HTTP monitor check?
The status code and the response time, and optionally the TLS certificate. Each check sends one request from the public internet and compares the final response with what you expect:
| Option | Behavior |
|---|---|
| Method | GET, POST, or HEAD in the dashboard; PUT as well through the API |
| Expected status | Exact match on one HTTP status code (the dashboard fills in 200). Without one, set through the API, any 2xx or 3xx passes |
| Redirects | Followed. The status of the final response is the one compared |
| Timeout | 10 seconds by default, adjustable from 1 to 60 seconds |
| Check SSL certificate expiry | Optional. The check fails once the certificate has expired |
| Headers and body | Set through the API, for endpoints that need a token or a POST payload |
Faultline refuses URLs that resolve to localhost or a private network address, so it cannot be pointed at internal hosts. For a service with no public URL, use a heartbeat instead: CLI and heartbeats.
2. When will it alert? (about 1 minute)
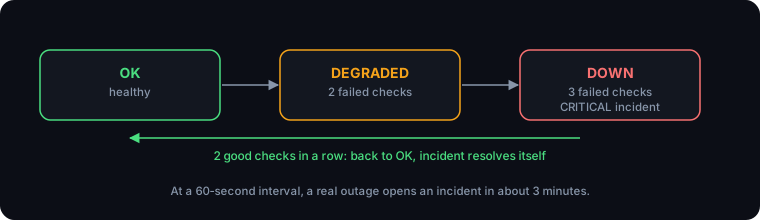
Every check is retried before it counts as a failure, and a monitor changes state only after several results in a row, so one slow response never pages anyone. New monitors use these defaults:
| Setting | Default | What it means |
|---|---|---|
| Timeout | 10 seconds | A request slower than this fails |
| Retries | 3, with backoff | A check fails only after every retry fails |
| Degraded | 2 failed checks in a row | Status turns DEGRADED; no incident yet |
| Down | 3 failed checks in a row | Status turns DOWN and a CRITICAL incident opens |
| Recovery | 2 good checks in a row | Status returns to OK and the incident resolves itself |
At a 60-second interval, a real outage opens an incident in about 3 minutes, and a blip that clears within 2 minutes never pages you.
3. Route the alert (about 2 minutes)
An incident on its own only shows up in the dashboard. If you clicked Email me right after adding your first service at signup, this is already done: you have an email channel and a rule for every service. Otherwise, add a notification channel and an alert rule:
- Open Settings, Notifications and add a channel: email, Slack (incoming webhook), PagerDuty (routing key), or a signed webhook.
- Under Alert Rules, click Add Rule, pick the minimum severity and the service (or all services), and tick the channel.
On Pro and above, add an escalation policy so an unacknowledged incident keeps paging until someone owns it:
- Open On-Call and Escalation and click New Escalation Policy.
- Add steps. Each step has a delay and one or more targets: notify a person, assign a person, notify a channel, or notify whoever is on call for a rotation. Example: step 1 at 0 minutes notifies on-call; step 2 at 10 minutes notifies the whole team channel.
- Back in Settings, Notifications, edit your alert rule and set its Escalation policy. Escalation stops as soon as anyone acknowledges the incident.
4. Trigger a test incident (about 3 to 4 minutes, mostly waiting)
Do this once so you know the whole path works, from failed check to your phone. Nothing needs to break: you change what Faultline expects instead.
- Open the service, click Edit, and change the expected status code to one your endpoint will never return, such as
418(a joke status real servers do not send). Save. - Wait three check intervals. The service goes DEGRADED, then DOWN, and a CRITICAL incident opens.
- Confirm the notification arrived on your channel (and, with an escalation policy, that the on-call person was paged).
- Acknowledge the incident to stop escalation.
- Change the expected status code back. After two good checks the service returns to OK and the incident resolves itself, with the full timeline kept.
How many monitors can I add, and how often do they run?
It depends on the plan. Free covers 5 monitors checked every 60 seconds; paid plans add more monitors and shorter intervals:
| Plan | Monitors | Shortest interval |
|---|---|---|
| Free | 5 | 60 seconds |
| Pro | 50, more billed as overage | 30 seconds, 15 with the interval add-on |
| Growth | 150, more billed as overage | 15 seconds |
| Enterprise | Unlimited | 15 seconds, down to 5 by contract |
What if the first check fails?
The error on the check tells you which of these it is:
- Request timed out: the endpoint took longer than the timeout. Point the monitor at a lighter health route, or raise the timeout (up to 60 seconds).
- Unexpected status: 401 or 403: the endpoint needs credentials. Use a public health route, or send an auth header through the API.
- Unexpected status: 404: the path is wrong, often a missing or extra trailing slash. Redirects are followed, so a 404 is the real final answer.
- Resolves to a non-public address: the hostname points at localhost or a private network. Faultline only checks public URLs; use a heartbeat for internal services.
Where to go next
- Watch a cron job or queue worker: CLI and heartbeats.
- Monitor ECS services: AWS IAM role setup.
- Fix the common failures automatically, with approval: Runbooks and approvals.
More docs
- AWS IAM role setupThe exact trust and permission policies, read-only first, remediation optional.
- Runbooks and approvalsApproval by default, per-runbook auto-run, verification, and the audit trail.
- Connect Claude (MCP)API key, Claude Code and Claude Desktop config, tools, and a sample session.
- CLI and heartbeatsMonitor cron jobs, queue workers, and Docker containers.
- Security and data handlingTenant isolation, sign-in, AI data flow, token caps, and retention.